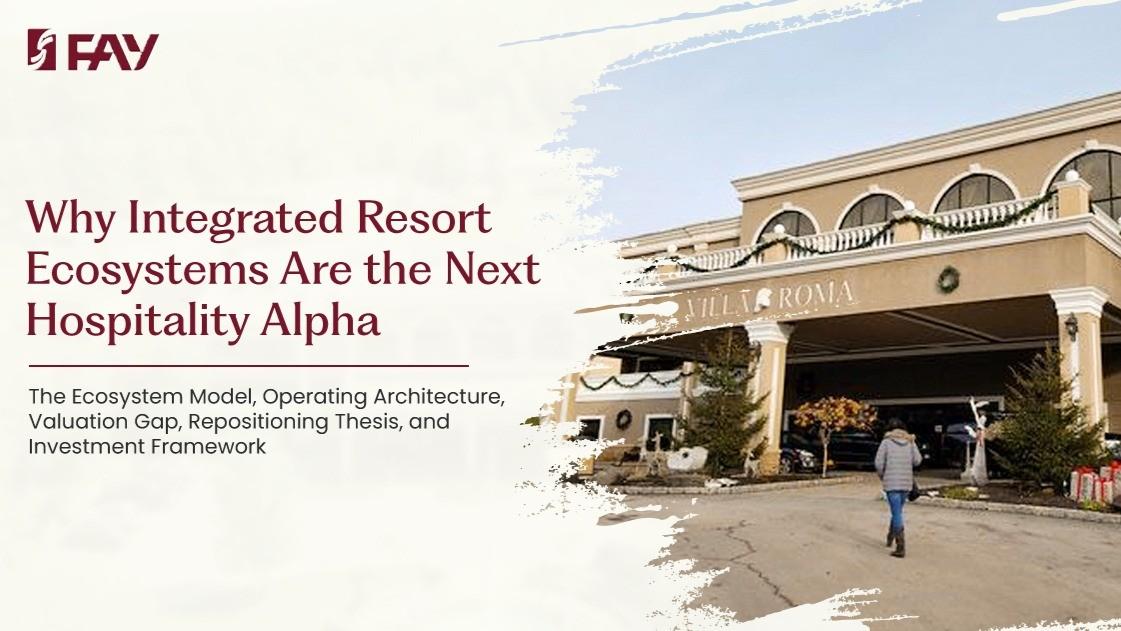
Why Integrated Resort Ecosystems Are the Next Hospitality Alpha
The Ecosystem Model, Operating Architecture, Valuation Gap, Repositioning Thesis, and Investment Framework Part I of this series established the structural forces concentrating upper-income American leisure demand into regional drive-to markets. This article answers the investor’s question: which assets capture that demand, how should they be operated, and what is the return?
THE ECOSYSTEM MODEL
Why Integrated Resorts in Regional Markets Are Categorically Different from Hotels
The word ecosystem is used deliberately, and it is worth explaining precisely why. A hotel is an asset. An ecosystem is a set of interdependent relationships that collectively produce something no single component could generate alone. The distinction is not semantic, it determines whether a hospitality asset is replaceable by a better-capitalized competitor or whether it occupies a position in its market that no amount of new capital can simply purchase.
The integrated resort becomes an ecosystem when the following conditions obtain: its programming, entertainment, and activities are drawn from and embedded in the surrounding regional community; its culinary identity is built around local agricultural and artisan supply chains; its wellness practitioners have genuine roots in the local professional ecosystem; its event calendar is connected to regional cultural institutions, performing arts organizations, and seasonal traditions; and its guest relationship is built on the sense that arriving at this property is arriving at a place that belongs to a specific geography, not a standardized product that could exist anywhere in the same configuration. Each of these conditions takes years to build. Each is resistant to competitive replication by an incoming operator with capital but without tenure. The golf course and the spa can be renovated in eighteen months.
The relationship with the regional farm that anchors the dining program, the partnership with the performing arts center that defines the summer entertainment calendar, the practitioner community that gives the wellness program its credibility, and the decades of community trust that allow a resort to function as an economic anchor for its surrounding region, none of these can be acquired. They must be built. And they compound in value with each year of intentional investment.
The community relationships that constitute a genuine resort ecosystem arrive with tenure and cannot be reverse-engineered by a new entrant with capital. This is the most defensible competitive moat in regional hospitality.
This has a direct implication for how the asset should be evaluated at underwriting. The community moat, the depth of supply chain relationships, cultural institution partnerships, practitioner networks, and regional identity, is a quantifiable driver of future pricing power, direct booking rate, and repeat guest frequency.
It is not qualitative color added after the financial model is complete. It is an input to the model, and it should be assessed with the same rigor applied to physical infrastructure. Sullivan County in the western Catskills illustrates this dynamic with particular clarity. The county sits within approximately two hours of New York City, the largest high-income leisure feeder market in the country. Visitor spending has grown more than 150 percent since 2019, according to the Sullivan County Office of Economic Development. The Sullivan Catskills Visitors Association launched a $300,000 tourism grant program in late 2025, funded from lodging tax revenues, to deepen regional identity and drive overnight visitation.
In late 2025, Sullivan County’s Local Development Corporation voted to issue up to $585 million in bonds to acquire the non-gaming resort assets of Resorts World Catskills: hotels, a golf course, restaurants, and 1,700 acres, with the explicit intention of unlocking integrated resort development at scale. Even if the deal didn’t go through because of certain reasons these are institutional signals, not anecdotal ones. Capital, policy, and regional economic strategy are converging on the same thesis.
THE OPERATING MODEL
From Room Nights to Stay Design, Five Structural Shifts
Capturing the demand described in Part I requires a different operating model, not a different marketing strategy. The regional integrated resort that responds to structural demand shifts by updating its website and adding a package rate is not repositioning, it is decorating. The genuine operating model transition this demand environment rewards involves five structural shifts, each with measurable financial consequences.
1. The Stay as the Unit of Commerce
The room-centric model concentrates commercial energy on rate per night and occupancy percentage. Both remain important. Neither captures the full economic relationship between a guest and a well-run integrated resort. The stay, not the night, is the correct unit of commerce. Package architecture, which designs the entire visit as a product with a defined experience, a bundled price point, and an intentional sequence of programming, entertainment, activities, and wellness touchpoints, produces a materially different revenue outcome than rate optimization applied to undifferentiated room inventory.
The financial consequence of this shift is captured in the gap between RevPAR and TRevPAR. RevPAR measures room revenue efficiency. TRevPAR measures total revenue per available room, including food and beverage, wellness, programming, activities, entertainment, and all ancillary spend. For a well-run integrated resort with genuine programming depth, the gap between RevPAR and TRevPAR is where the investment return lives. Properties that have made this transition have demonstrated TRevPAR uplifts of 25 to 40 percent over their pre-repositioning baseline, with the ancillary revenue mix moving from approximately 15 percent of total revenue to 30 percent or above.
2. Programming, Entertainment, Activities, and Wellness as Primary Revenue Drivers
In a room-led model, programming, entertainment, activities, and wellness are amenities, support functions that justify the room rate but are not managed as discrete revenue centers or demand drivers. In an ecosystem-led model, they are the product. This distinction has consequences across every dimension of the business: how capital is allocated, how staff is recruited, how the property is marketed, and how guests select and return. Programming works commercially when it is structured as a product guests can plan around, communicate about, and purchase in advance. A spa treatment menu is an amenity.
A structured wellness retreat with a defined three-day arc, organized around movement, recovery, nutrition, and mindfulness, is a product with its own booking engine, a program-specific price point, and a distinct demand cohort that will travel specifically to experience it. Entertainment programming, live performance, cultural events, chef collaborations, and seasonal celebrations function as demand drivers when woven into the identity of the resort rather than offered as a peripheral listing on a printed activities calendar. Activities that connect guests to the regional landscape, artisan community, and cultural calendar deepen the stay and generate ancillary revenue in direct proportion to how well they are integrated into the overall guest experience. Resonance Consultancy’s 2026 research finds that among the top 1 percent of American leisure travelers, the share planning a primary wellness trip in the next 12 months has risen from 23 percent in 2019 to 34 percent today.
Among the top 10 percent, the share of leisure spending allocated to wellness has risen from 15 percent in 2019 to 21 percent in 2025. The global wellness tourism market reached approximately $990 billion in 2025, growing at 9.3 percent annually. These figures represent a structural reallocation of the premium leisure budget toward properties that can deliver coherent, credible programming, entertainment, activities, and a wellness offer, not a wellness trend.
3. Direct Relationships over OTA Dependency
OTAs captured 61 percent of bookings for independent properties in 2024, compared with 35 percent for branded properties, according to Cloudbeds’ 2025 State of Independent Lodging Report. This commission drag is a meaningful headwind on net RevPAR for independent operators, and it is particularly consequential for properties competing on total guest yield, because OTA economics are built around the room transaction and capture none of the ancillary value the guest generates on-property. The path from OTA dependency to direct relationship is an operating model decision, not a marketing one.
A resort that has built genuine programming depth, a defined guest community, and a direct communication channel, email, membership architecture, loyalty structure is not simply saving commission. It is building a distribution asset that compounds in value with each repeat guest relationship developed. As AI-driven trip planning accelerates, Phocuswright data shows 40 percent of US travelers used generative AI to plan trips in 2025, an 11-point jump in a single year; the independent property built for AI discovery and optimized for direct booking conversion gains a distribution advantage over branded flags relying on legacy OTA infrastructure. This is a structural competitive shift that most operators have not yet recognized.
4. From RevPAR to Lifetime Guest Value
The productive escapist who returns to a regional resort four to six times annually, spending $600 to $1,000 per stay including meaningful ancillary engagement, has a two-year value of $8,000 to $36,000. The economics of investing in the programming, workspace, and direct relationship that retains this guest are radically different from the economics of optimizing OTA conversion rates to fill undifferentiated room inventory. Lifetime guest value recasts the economics of guest acquisition entirely, and it is the metric that, once adopted, reveals how irrational OTA dependency is as a long-term distribution strategy for an ecosystem-led resort.
5. Year-Round Yield Through Programming Calendars
Legacy integrated resorts in seasonal leisure markets have historically concentrated revenue into a compressed summer and holiday period, leaving fixed cost structures exposed through quieter months. The programming-led operating model eliminates the hard edge of the leisure season by building demand across the full calendar year: wellness retreats in January and February, culinary programming and cultural events in spring and fall, outdoor activities and entertainment in summer, and structured family programming in school holiday periods.
This is not a scheduling exercise; it is a revenue architecture decision that directly improves fixed cost coverage, reduces earnings volatility, and improves the quality of NOI for underwriting purposes at exit. Exhibit 1, Operating Model Comparison: Room-Led vs. Ecosystem-Led Integrated Resort
| Dimension | Room-Led Model | Ecosystem-Led Integrated Resort |
|---|---|---|
| Primary value driver | Room quality and brand flag | Programming, entertainment, activities, and wellness |
| Unit of commerce | Room night, rate and occupancy | The stay, designed, packaged, priced holistically |
| Primary KPI | RevPAR, ADR, Occupancy % | TRevPAR, Ancillary mix %, Lifetime Guest Value |
| Revenue composition | Rooms-led (70–80% of total) | Diversified: rooms, F&B, wellness, activities, programming |
| Guest motivation | Rate and brand familiarity | Destination identity and programming depth |
| Loyalty mechanism | Points program | Relationship to place, practitioner, and community |
| Distribution model | OTA-dependent (61% of independent bookings per Cloudbeds 2025) | Direct-first: community relationship, reduced OTA dependency |
| Capital priorities | Room refurbishment | Programming, F&B, wellness, connectivity, activities infrastructure |
| Competitive moat | Modest, replicable by capital | High, built from tenure, community, and identity over years |
| Exit buyer pool | Value-add and opportunistic capital | Core-plus and institutional capital at repositioned stabilization |
Source: FAY Investment Group analysis. OTA share data per Cloudbeds’ 2025 State of Independent Lodging Report. Ancillary revenue mix data per FAY repositioning analysis.
THE CASE AGAINST NEW BUILD
Why Repositioning Legacy Assets Outperforms Greenfield Development
A sophisticated investor encountering the regionalization thesis will ask a reasonable question: if the demand thesis is this compelling, why not build new? The answer involves three compounding factors that, together, make adaptive reuse of legacy integrated resort assets the structurally superior entry strategy in the current environment.
- Cost: Construction cost escalation. The cost of building a comparable integrated resort from the ground up has risen 30 to 45 percent since 2019, driven by materials inflation, labor market tightness, and supply chain normalization following global disruption. A legacy resort acquired at 60 to 80 percent of replacement cost delivers the investor the same physical infrastructure at a fraction of the new-build cost, with an established land position, existing utilities, operational systems, and often an entitlement history that eliminates years of permitting exposure.
- Timeline: Entitlement and timeline risk. A greenfield resort development in a desirable regional market typically requires three to five years from site control to first guest. That timeline encompasses environmental review, municipal permitting, utility infrastructure, construction, hiring, and pre-opening. The repositioned legacy asset can reach repositioned operations in 18 to 30 months from acquisition, capturing demand that is present now rather than demand projected for a future market cycle.
- Moat: Community moat and regional identity. The most valuable competitive attribute of the integrated resort ecosystem, its community relationships, regional identity, cultural institution partnerships, and guest memory, cannot be manufactured with capital. It must be built with time. A 40-year-old legacy resort with genuine regional roots, even if operationally underperforming, carries community equity that no new entrant can replicate in less than a decade. Acquiring and repositioning that asset preserves and unlocks community equity that a new build cannot access at any price.
This does not mean all legacy resort acquisitions are compelling. It means the acquisition thesis must be evaluated on asset capability, the gap between what the physical and community infrastructure can support under an ecosystem-led operating model, rather than on historical room revenue performance. The investor applying a RevPAR lens to a multi-outlet integrated resort with 400 acres, established cultural relationships, and a drive-to location within two hours of a major metropolitan market is measuring the least relevant dimension of the asset’s value.
THE VALUATION GAP
Where the Return Lives, Repositioning Arithmetic
The investment return in the regionalization thesis is generated by the gap between two different valuation frameworks applied to the same asset: the distressed hotel framework that governs entry price, and the experience-led ecosystem framework that governs exit price once the operating model transition has been executed. At entry, legacy integrated resort assets in drive-to markets are assessed primarily on current room revenue, typically at 6.0 to 8.5 percent cap rates applied to suppressed NOI, reflecting underinvestment in programming, F&B, and guest experience. This produces entry prices at 60 to 80 percent of replacement cost in most current market conditions. The discount is real and verifiable. It reflects historical underperformance, not asset capability.
The repositioning program, executed over 24 to 36 months with disciplined capital deployment sequenced to generate early operating improvement, transitions the revenue architecture from room-led to ecosystem-led. Programming, entertainment, and activity infrastructure are activated first, generating immediate TRevPAR improvement with limited capital outlay. F&B ecosystem development follows, moving the ancillary revenue mix from the 12 to 18 percent typical of room-led resort operations toward the 28 to 35 percent range characteristic of well-run integrated resort ecosystems. Physical renovation of accommodation and amenity infrastructure is sequenced to follow operating cash flow improvement, reducing the equity at risk in the early transition period.
The financial consequence: a property entering repositioning at a 6.5% cap rate on suppressed NOI can, under a credible ecosystem-led operating model, exit at a 5.0 to 5.5% cap rate on materially higher stabilized NOI. The compression in cap rate reflects both the income improvement and the expansion of the buyer pool from value-add and opportunistic capital to core-plus and institutional capital. These two effects compound. Their combination is where the leveraged return is built.
Exhibit 2
The Valuation Gap: Entry Pricing vs. Repositioned Potential
| 01 ENTRY |
Current pricing — room-revenue basis, distressed operations | 60–80% of replacement cost |
| Cap rate 6.0–8.5% on suppressed NOI. Underinvestment in programming and F&B. Assessed on current income, not asset capability. | ||
| 02 REPLACEMENT |
New-build comparable resort, 2026 construction costs | 100% baseline |
| Construction costs up 30–45% since 2019. Legacy acquisition delivers same physical infrastructure at a fraction of new-build cost — without entitlement or timeline risk. | ||
| 03 REPOSITIONED |
After operating model transition (24–36 months) | 125–140% of prior baseline |
| Ecosystem-led model activated. TRevPAR uplift 25–40%. Ancillary revenue mix 28–35%. Direct booking channel established. Stabilizing NOI trajectory. | ||
| 04 EXIT |
Ecosystem valuation — institutional pricing | Institutional pricing |
| Core-plus buyer pool. Cap rate compression to 5.0–5.5% on stabilized NOI. Larger buyer universe is an independent return driver separate from income improvement. |
Income improvement + buyer pool expansion = compounded return
Source: FAY Investment Group analysis. Cap rate data informed by CBRE US Cap Rate Survey 2025 and JLL Hotel Investor Sentiment Survey 2025. The TRevPAR uplift range reflects the FAY analysis of repositioned experience-led resort assets. Grand View Research Global Resort Market 2024–2030 for market growth projection.
THE INVESTMENT FRAMEWORK
What Disciplined Capital Should Be Underwriting Now
The investment thesis described in this series is not an argument for broad exposure to US hospitality. It is an argument for selective, disciplined investment in a specific category of asset, the regional integrated resort in a high-income drive-to market, at a specific moment in the demand and valuation cycle. The return available here is not a market return. It is a selection and execution return, available to capital that can identify the right asset, underwrite it correctly, and bring the operational capability required to close the gap between current performance and achievable performance.
The Right Metrics
Underwriting integrated resort assets on RevPAR alone is the most common error in conventional hospitality analysis, and it is the primary reason why these assets remain systematically undervalued relative to their potential. The correct underwriting framework begins with TRevPAR as the primary operating metric. It incorporates the current ancillary revenue mix as a baseline and models the credible trajectory of that mix under an ecosystem-led operating model. It assigns explicit value to the community relationships, regional identity, and programming infrastructure that constitute the asset’s competitive moat, as quantified drivers of future direct booking rate, repeat guest frequency, and premium pricing power, not as a qualitative narrative. And it applies a replacement cost analysis that reflects the gap between what it would cost to build the physical asset today and what the acquisition price implies.
Five Asset Selection Criteria
- Drive-to market position within two to three hours of a metropolitan area with a population of at least one million and median household income at or above the national upper-decile threshold. The feeder market must be large enough and affluent enough to sustain year-round demand across the three archetypes described in Part I.
- Irreplaceable physical infrastructure, established land, multi-outlet F&B facilities, and recreational amenities that carry meaningful value at a significant discount to current replacement cost. The asset must be one that capital alone cannot replicate quickly or cheaply.
- Existing but underdeployed community relationships, regional supply chains, cultural institution connections, and practitioner ecosystem presence that provide the raw material for ecosystem development. These relationships are the hardest dimension to build from zero and the most valuable once assembled.
- Supply constraint in the experience-led segment. The market should have limited credible competition in the upper-income experiential leisure category, creating pricing power for the correctly repositioned asset before new supply can respond.
- Municipal and institutional support indicators, tourism infrastructure investment, development incentive programs, and permitting efficiency that confirm alignment between the asset’s repositioning thesis and the regional economic development trajectory.
Capital Structure and Hold Period
This is a four-to-five-year hold thesis, minimum. The operating model transition described above does not produce its full financial effect in twelve months. Programming development, F&B ecosystem construction, community relationship deepening, and direct booking channel development all require time as well as capital. The investment structure must accommodate this: sufficient equity to absorb the transition period without distress, a debt structure that does not create maturity pressure during the repositioning phase, and a hold period long enough to allow operating model improvement to be fully reflected in stabilized NOI.
In qualifying geographies, the EB-5 Rural Targeted Employment Area program provides a capital formation mechanism with structural advantages aligned to this hold profile: reduced minimum investment thresholds, priority petition processing, and a patient capital structure well-matched to the timeline requirements of a legacy resort repositioning. Sullivan County’s Rural TEA designation is an example of a market where policy infrastructure and development opportunity are explicitly aligned.
The Exit Thesis
The exit valuation for a well-executed integrated resort repositioning is determined by a different framework than the entry valuation. Entry price reflects the distressed hotel model, RevPAR-anchored, operationally underperforming, assessed on current income rather than asset capability. Exit price reflects the ecosystem-led model, TRevPAR-based, with a diversified revenue mix, a direct guest relationship, a defined community moat, and a stabilized operating platform that institutional buyers can underwrite with confidence.
The expansion of the buyer pool at exit, from value-add and opportunistic capital to core-plus and institutional capital, is itself a source of cap rate compression independent of any improvement in underlying income. An asset that has been correctly repositioned and holds a demonstrable ecosystem position in its regional market will attract a materially different and larger set of acquirers than it did at entry. That difference, combined with the income improvement generated by the operating model transition, is where the compounded return is constructed. Exhibit 3, Regional Drive-To Market Selection Criteria and Illustration
| Criterion | What to Look For | Sullivan County Illustration |
|---|---|---|
| Metro proximity | 2–3 hour drive from 1M+ population metro with top-decile median income | Within 2 hours of New York City, the largest high-income leisure feeder market in the US |
| Demand trajectory | Visitor spending growth above national leisure average, sustained over 3+ years | Visitor spending growth exceeding 150% since 2019 (Sullivan County Office of Economic Development) |
| Supply constraint | Limited credible experience-led resort product in the upper segment of the market | Significant undersupply of repositioned, ecosystem-led integrated resort inventory |
| Cultural and natural anchors | Regional demand generators independent of any single property | Bethel Woods Center for the Arts, Upper Delaware River, artisan F&B community in Callicoon |
| Institutional support | Municipal tourism investment, incentive programs, development infrastructure | $585M LDC bond transaction 2025, $300K SCVA tourism grant program, EB-5 Rural TEA designation |
| Adaptive reuse potential | Existing infrastructure at meaningful discount to replacement cost | Legacy resort assets with established land, multi-outlet F&B, and recreational infrastructure |
Source: FAY Investment Group analysis. Sullivan County presented as an illustrative case study. Visitor spending data per Sullivan County Office of Economic Development. LDC transaction and SCVA grant program per publicly available Sullivan County records, 2025.
CONCLUSION
The Recalibration Is the Opportunity
The structural forces described across this series, geopolitical uncertainty and distributed work, are not temporary conditions waiting to be resolved. Geopolitical complexity has been the defining feature of the global economic environment for the better part of a decade. Hybrid work has proven structurally durable through multiple rounds of return-to-office pressure, embedded in private-sector labor markets because the workforce capable of demanding it is the workforce employers most need to retain. Neither force is reversing. Both continue to operate in the same direction, concentrating upper-income American leisure demand in regional markets, in drive-to resort destinations, and in properties with the depth of programming, entertainment, activities, and wellness that the guest redirecting their leisure ambition homeward is prepared to pay a meaningful premium to access.
The investment implication is specific. The assets that benefit from this recalibration are not all hotels. They are not all resorts. They are a defined category, the integrated resort with genuine ecosystem depth, in a regional market with strong feeder demographics, trading at a valuation that reflects its historical performance rather than its structural position in the path of redirected demand. PwC’s 2026 US Hospitality Directions outlook describes 2026 as presenting opportunities for dealmakers with conviction and balance sheet agility. The bid-ask spread on these assets is narrowing. The operating performance benchmarks that will reset their valuation frameworks are being established now by first movers who repositioned early.
The return in this thesis does not require the global environment to improve. It does not depend on a recovery in cross-border travel, a normalization of geopolitical conditions, or a reversal of hybrid work patterns. It depends on those conditions persisting long enough for the domestic regional leisure market to continue absorbing the demand that has been redirected into it. On the current trajectory, and on the evidence of the demand, spending, and institutional capital data assembled in this series, that persistence is not a forecast risk. It is the base case.
The gap between what these assets currently trade at and what they will be worth when the operating model is aligned with where the market is moving is where the return resides. That gap is still open. It will not remain so indefinitely.
About FAY Investment Group
FAY Investment Group is a US-based real estate investment and asset management firm focused on institutional-quality investments across hospitality, commercial, and mixed-use real estate. The firm pursues value creation through active asset management, disciplined capital structuring, and long-term capital appreciation. Sandeep Wadhwa is Chairman of FAY Investment Group with over two decades of experience in hospitality and real estate investing across global markets. His approach focuses on discipline, execution, and the identification of structurally underpriced assets ahead of demand recognition.


Integrated Resort Community & Wellness Living | By Sandeep Wadhwa
[…] resort with a resident community owns something a transient hotel lacks, namely a year-round population that lives on the campus […]