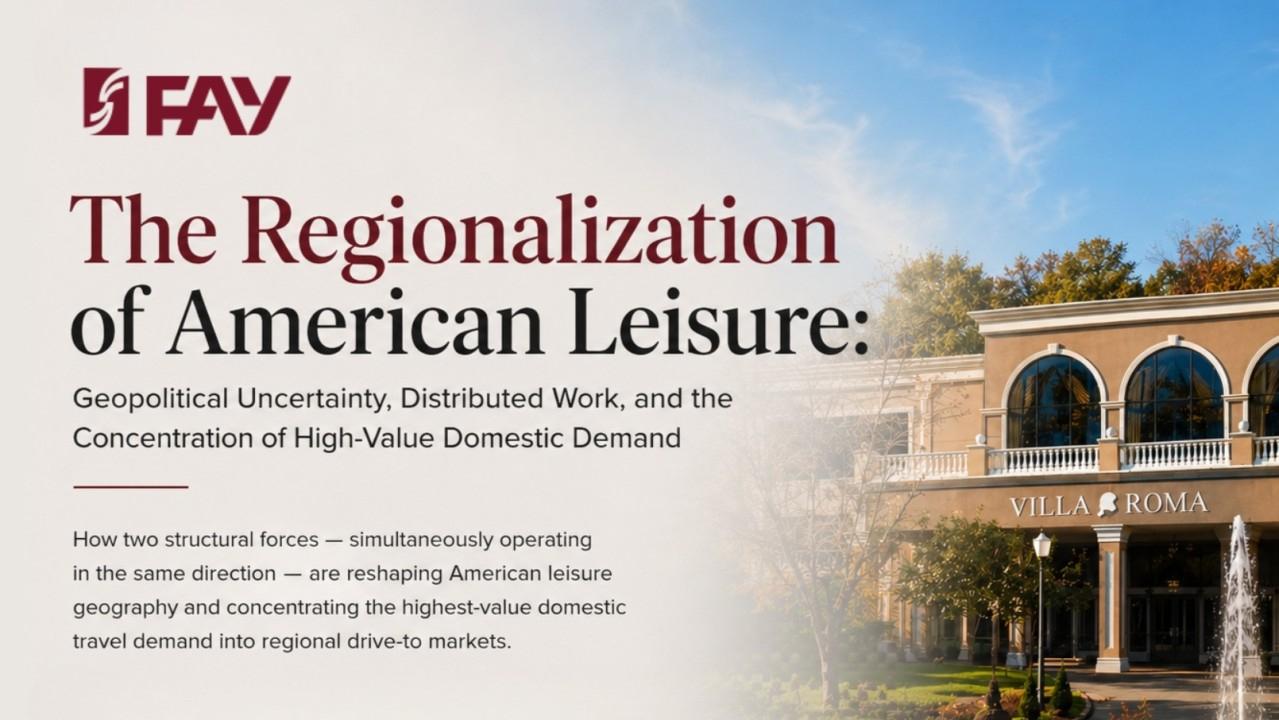
The Regionalization of American Leisure
A Structural Shift, Not a Seasonal Trend
Leisure geography in America is contracting toward the regional. This is not a pandemic hangover, a soft economic quarter, or a temporary response to elevated airfares. It is the compounding result of two structural forces, each independently powerful enough to produce this outcome, operating simultaneously, in the same direction, reinforcing the same behavioral shift in the same market.
The first force is geopolitical uncertainty. Across every major economy, the friction associated with cross-border movement has increased: policy unpredictability, visa complexity, currency volatility, and the ambient cognitive weight of navigating a world that is harder to plan around than it was five years ago. The consequence is not that people stop traveling. It is that they travel closer, and when they do, they go deeper.
The second force is the distributed workforce. Hybrid and remote work arrangements have structurally altered how the highest-income segment of American households allocates discretionary time. When the boundary between the work week and the leisure week becomes porous, the patterns of leisure travel change with it. Extended stays become logistically viable. Midweek demand deepens. The drive-to regional resort, within two to three hours of a major metropolitan labor market, becomes the most accessible and most programmable leisure environment available to the professional who can depart on a Wednesday and return on a Sunday without consequence.
Together, these two forces are producing what this article describes as the regionalization of American leisure, a measurable shift in where the highest-value domestic travel demand is concentrating, how long it stays, what it spends, and what it requires from the assets it chooses. Part II of this series will examine how the integrated resort ecosystem is positioned to capture that demand, and what the investment opportunity looks like for capital willing to act on it. This first part establishes the structural case: why the shift is happening, who is driving it, and what they are looking for.
THE FIRST FORCE
Geopolitical Uncertainty and the Compression of Travel Geography
Geopolitical risk is not a new variable in travel economics. Its effects on international tourism, suppressing cross-border demand, shifting itinerary planning toward closer and more predictable destinations, increasing the perceived cost of international travel are well-documented across prior cycles. What distinguishes the current environment is the breadth and simultaneity of the pressures involved.
The IMF’s World Uncertainty Index reached multi-year highs in 2025, reflecting a global landscape in which policy unpredictability is operating across trade relationships, immigration frameworks, diplomatic alignments, and energy markets simultaneously. The Global Business Travel Association’s Q1 2026 survey found that 79 percent of global business travel professionals cite geopolitical instability as their leading concern, with industry optimism dropping from 59 percent in January 2026 to 41 percent by April. That 18-point shift in a single quarter reflects how rapidly confidence moves when the external environment changes.
The mechanism through which geopolitical uncertainty affects leisure behavior is primarily cognitive, not economic. The upper-income traveler considering an international itinerary faces a planning environment that has become materially more complex: longer visa processing windows, greater entry requirement uncertainty, currency markets harder to forecast, and the sense that conditions planned six months in advance may not resemble conditions at departure. The rational response is not to stop traveling, it is to simplify the itinerary. Regional domestic destinations, accessible by car and bookable on shorter lead times, satisfy every criterion for a lower-friction, higher-certainty leisure experience.
Geopolitical uncertainty does not destroy travel demand. It compresses its geography and concentrates its intensity into closer, more deliberate destinations.
The data reflects this mechanism precisely. According to the US Travel Association’s Spring 2026 forecast, domestic leisure is the only travel vertical where total spending currently exceeds 2019 inflation-adjusted levels, reaching $909 billion in 2026. International inbound travel spending, by contrast, fell 2.4 percent in 2025 to $175 billion, remaining 18 percent below 2019 levels. A return to 2019 inbound volumes is not projected until 2029. Domestic travel now accounts for 87 percent of total US travel spending, a structural dominance that has strengthened through the period of global disruption, not weakened.
Exhibit 1
US Domestic Leisure Travel Spending, 2019–2026 (Estimated, $B)
| Year | Spending | Index | Note |
|---|---|---|---|
| 2019 | $799B | ██████████████████ 88% | Pre-pandemic baseline |
| 2020 | $390B | █████████ 43% | Pandemic trough |
| 2021 | $621B | ██████████████ 68% | Recovery begins |
| 2022 | $788B | █████████████████ 87% | Domestic surge |
| 2023 | $855B | ███████████████████ 94% | — |
| 2024 | $876B | ███████████████████ 96% | — |
| 2025 | $900B | ████████████████████ 99% | Exceeds 2019 (inflation-adj.), forecast |
| 2026 | $909B | ████████████████████ 100% | Forecast |
Source: US Travel Association Domestic Leisure Travel Spending data: Spring 2026 Forecast. 2025–2026 figures reflect the forecast. Inflation-adjusted comparison to 2019 baseline per US Travel Association methodology.
THE MARKET BIFURCATION
This Is a High-Income Demand Story, Not a Broad Market Story
Before addressing the second structural force, it is worth stating explicitly what this article is and is not arguing. The regionalization of American leisure is not a broad-market thesis. It is a high-income segment thesis, and investors who conflate general domestic leisure growth with the specific demand concentration this article describes will underwrite the wrong assets.
The bifurcation within the US travel market is stark and documented. Moody Analytics estimates that the top 10 percent of Americans by annual income now account for nearly half of all consumer spending, up from 35 percent in the early 1990s. In travel, the concentration is even more pronounced. Resonance Consultancy’s 2026 Future of Luxury Travel report, drawing on longitudinal research tracking affluent American households since 2007, finds that the top 10 percent and top 1 percent now collectively drive more than half of all US leisure expenditure, with their combined spending projected at $544 billion in 2026.
The per-trip economics of this cohort have shifted materially. The top 10 percent now spend an average of $7,900 per trip, up from $5,100 in 2022. The top 1 percent spend an average of $12,400 per trip, up from $8,400. The average US traveler, by comparison, spends $3,700 per trip. This divergence is not a temporary post-pandemic phenomenon, it reflects a structural concentration of discretionary spending power that has been building for a decade and is now reshaping the hospitality investment landscape in a direction that clearly favors the upper end of the experience spectrum.
PwC’s US Hospitality Directions 2026 confirms the supply-side expression of this bifurcation: higher-priced hotels are outperforming, supported by resilient spending among higher-income households, while lower-priced properties face continued RevPAR headwinds as inflationary pressure constrains the middle and lower segments. STR data confirms luxury chain-scale average daily rates grew 5.7 percent in 2025, while mid-scale and economy segments saw near-zero growth. The market is not rising uniformly. It is concentrating value at the upper end, and the upper end is increasingly domestic, increasingly regional, and increasingly experience-driven.
Exhibit 2, US Leisure Market Bifurcation: Spending by Income Segment, 2026
| Segment | Leisure Spend 2026 | Per-Trip Average | ADR Growth 2025 | Market Direction |
|---|---|---|---|---|
| Top 1% households | $12,400 per trip | $12,400 | Luxury ADR +5.7% (STR) | ↑ Outperforming |
| Top 10% households | $544B collectively | $7,900 per trip | Luxury leads all segments | ↑ Outperforming |
| Avg. US traveler | Broad domestic market | $3,700 per trip | Mid-scale near-zero growth | → Flat to soft |
| Lower-income households | Budget-constrained | Shortening trip duration | Economy flat | ↓ Under pressure |
Source: Resonance Consultancy 2026 Future of Luxury Travel; STR 2025 Chain Scale Performance; PwC US Hospitality Directions 2026; Moody Analytics consumer spending data.
THE SECOND FORCE
Distributed Work and the Restructuring of the Leisure Week
The relationship between remote work and leisure travel behavior has been widely noted since 2020. It has rarely been analyzed with the precision it deserves as a structural driver of hospitality demand. The common framing, that remote workers can work from anywhere and therefore travel more, understates the mechanism considerably. The more consequential shift is that the schedule on which high-income professionals can access leisure has been structurally altered, with direct implications for the demand profile facing regional drive-to resorts.
The baseline figures are well-established. As of 2026, approximately 32.6 million Americans, 22 percent of the total workforce, work remotely. Among workers in roles where remote work is feasible, 52 percent operate in hybrid arrangements, according to Gallup’s ongoing workforce surveys. Stanford economist Nick Bloom’s research estimates that approximately 27 percent of all paid full-time US workdays are now worked from home, a figure that has held stable through multiple rounds of return-to-office pressure and has proven resistant to corporate mandates in competitive labor markets.
The hospitality implication is specific: the hybrid professional working three days in an office mid-week can depart for a regional resort on Wednesday evening and return Monday morning without using a single vacation day. The economic effect is a meaningful expansion of the viable booking window for regional drive-to resorts, not just on weekends but across a broader midweek period that was structurally inaccessible to the employed leisure traveler before 2020.
The bleisure segment, business travel extended to include leisure components, adds a further dimension. Navan’s 2026 data finds that 55 percent of business travelers took at least two bleisure trips in 2024, and the bleisure market is forecast to double by 2032. Critically, bleisure travelers spend an average of $1,566 per trip, more than pure leisure travelers, and 82 percent extend their stay at the same property used for their business engagement. For regional resorts positioned near secondary business markets, this is an incremental demand layer requiring no additional acquisition cost.
The income concentration within the remote and hybrid workforce compounds this effect materially. Remote and hybrid arrangements remain substantially more prevalent in knowledge-intensive sectors, technology, finance, professional services, marketing, where household incomes are disproportionately high. The worker who has the flexibility to extend a leisure trip midweek is also, on average, the worker with the discretionary income to spend meaningfully at a resort with genuine programming depth. This is not coincidental. It is the structural alignment between the workforce that has gained time flexibility and the consumer segment with the economic capacity to translate that flexibility into premium domestic leisure spending.
The hybrid workforce has not simply enabled more travel. It has changed the structure of when travel happens, and that change flows directly into the demand profile of regional integrated resorts.
THE DEMAND PROFILE
Three Guest Archetypes and What They Require
Understanding the structural forces driving regionalization is necessary but insufficient for operators and investors seeking to act on the thesis. The more actionable question is who, specifically, is generating this demand and what they require from the assets they choose. The following three archetypes are not marketing segments. They are distinct demand profiles, each with its own booking behavior, revenue contribution, loyalty mechanism, and programming requirement. Together, they represent the primary composition of upper-income regional leisure demand in 2026.
The Productive Escapist
The productive escapist is the hybrid or fully remote professional, typically 35 to 55, urban-based, high income, traveling to a regional resort within two to three hours of their home market. They book extended stays, frequently arriving midweek, and their decision to return to a specific property is driven by whether the visit allowed them to simultaneously decompress from professional demands and feel that they did not fall behind. This guest requires reliable high-capacity connectivity as a baseline expectation, dedicated workspace physically separate from the sleeping environment, and a programming calendar of activities, entertainment, and wellness that gives the stay a reason to exist beyond the room itself.
The productive escapist generates high total spend per visit, driven not by room rate but by ancillary engagement: dining across multiple outlets, programmed activities and entertainment, wellness services, and evening experiences. Their loyalty is to the place, not the brand. They return to a specific property that delivered the combination of productive environment and genuine experience, and they will not return to a property that failed in either dimension.
The Intentional Family
The intentional family represents a dual-income professional household, typically with two to three children, that has developed a growing aversion to the complexity and unpredictability of international travel. They are not unwilling to spend. They are redirecting the budget that would previously have funded an international trip into a domestic experience they can plan with confidence, drive to without airport friction, and repeat annually. This guest books multi-room or suite configurations, stays three to five nights, and drives the highest total group spend of any leisure archetype.
Their decision criteria are anchored in programming depth: not whether a pool exists, but whether there is a structured calendar of activities, entertainment, and family experiences that will genuinely engage their children and create memories rather than simply pass the time. They will pay a meaningful premium for a property that understands this distinction, and they will not return to a property that offers amenities without experiences.
The Wellness-Oriented Guest
The wellness-oriented guest books around a program. The retreat is the destination. This guest’s booking decision is structured entirely around whether the property’s programming, entertainment, activities, and wellness offerings can deliver a defined outcome: physical restoration, mental reset, nutritional recalibration, or some combination. The global wellness tourism market reached approximately $990 billion in 2025, growing at a compound annual growth rate of 9.3 percent, with North America holding the largest regional share at 35.9 percent, according to Grand View Research. Among the top 1 percent of US travelers, 34 percent are planning a trip primarily for health and wellness in the next 12 months, up from 23 percent in 2019.
The wellness-oriented guest is price-insensitive relative to every other leisure segment. Their willingness to pay is determined by the credibility and depth of the programming, not the physical attributes of the room or the brand flag on the building. They drive the highest ancillary revenue mix of any guest type, and their loyalty follows the quality of the practitioner relationship and the coherence of the programming architecture, not a global loyalty points program.
Exhibit 3, Guest Archetype Comparison: Demand Profile and Revenue Characteristics
| Dimension | The Productive Escapist | The Intentional Family | The Wellness-Oriented Guest |
|---|---|---|---|
| Profile | Hybrid/remote professional, 35–55, urban, high income | Dual-income household, 2–3 children, averse to airport complexity | Wellness-first traveler, books around a program, not a place |
| Stay pattern | Extended midweek arrival, 4–6 nights | 3–5 nights, multi-room or suite | 3–5 nights, structured around program arc |
| Primary driver | Productive environment + genuine experience | Programming depth and family memory-making | Credibility of wellness, activities, and practitioner quality |
| Revenue profile | High ancillary: F&B, activities, evening experiences | Highest total group spend of any archetype | Highest ancillary mix: wellness programs, specialist sessions, nutritional dining |
| Loyalty mechanism | Loyalty to the place, returns for environment and identity | Returns annually if children experienced the stay, not just enjoyed it | Follows the practitioner and program quality, not the flag |
| What they cannot find at a branded chain | Workspace coherence, regional identity, programming that isn’t generic | Activities calendar with genuine depth, not a babysitting list | Program-led retreat architecture, credible practitioner community |
Source: FAY Investment Group analysis. Informed by Resonance Consultancy 2026 Future of Luxury Travel; Grand View Research Global Wellness Tourism Market 2025; Navan Bleisure Travel Statistics 2026.
WHAT THIS MEANS, AND WHAT COMES NEXT
The Demand Is Already Arriving
The two structural forces described in this article are not projections. They are present conditions. Geopolitical uncertainty is operating across every major economy simultaneously. Hybrid work has been embedded in private-sector labor markets for five years and has proven durable through repeated attempts to reverse it. The demand concentration they are producing, upper-income, regionally mobile, experience-seeking, and extended-stay, is not a forecast. It is the composition of the guest who is booking regional leisure assets right now, in markets within drive-to distance of every major American metropolitan area.
What this demand requires from the assets it chooses is the subject of Part II of this series. The three archetypes described above share a common characteristic: none of them are looking for a better hotel. They are looking for a place with depth, programming, entertainment, activities, and wellness that give the stay a reason to exist and a reason to return. The integrated resort ecosystem, independently owned and operated within a regional community it is genuinely embedded in, is the format built to provide that depth. It is also, at current valuations, one of the most precisely defined investment opportunities in the US real estate landscape.
The regionalization of American leisure is not a trend to anticipate. It is a structural condition to act on. Part II examines how, and at what entry price.
Part II, Why Integrated Resort Ecosystems Are the Next Hospitality Alpha, addresses the ecosystem model, operating architecture, valuation gap, repositioning thesis, and investment framework. Available from FAY Investment Group.
About FAY Investment Group
FAY Investment Group is a US-based real estate investment and asset management firm focused on institutional-quality investments across hospitality, commercial, and mixed-use real estate. The firm pursues value creation through active asset management, disciplined capital structuring, and long-term capital appreciation.
Sandeep Wadhwa is Chairman of FAY Investment Group with over two decades of experience in hospitality and real estate investing across global markets. His approach focuses on discipline, execution, and the identification of structurally underpriced assets ahead of demand recognition.


Integrated Resort Ecosystems & Hospitality Investment
[…] I, The Regionalization of American Leisure is available from FAY Investment […]